The World in Motion
Watch the demo
AI-Built Excel Dashboards | ExcelMCP in Action - built by GPT-6 Astra through ExcelMCP, powered by Excel.
Watch on YouTube (2:33), with English captions.
Get the workbook
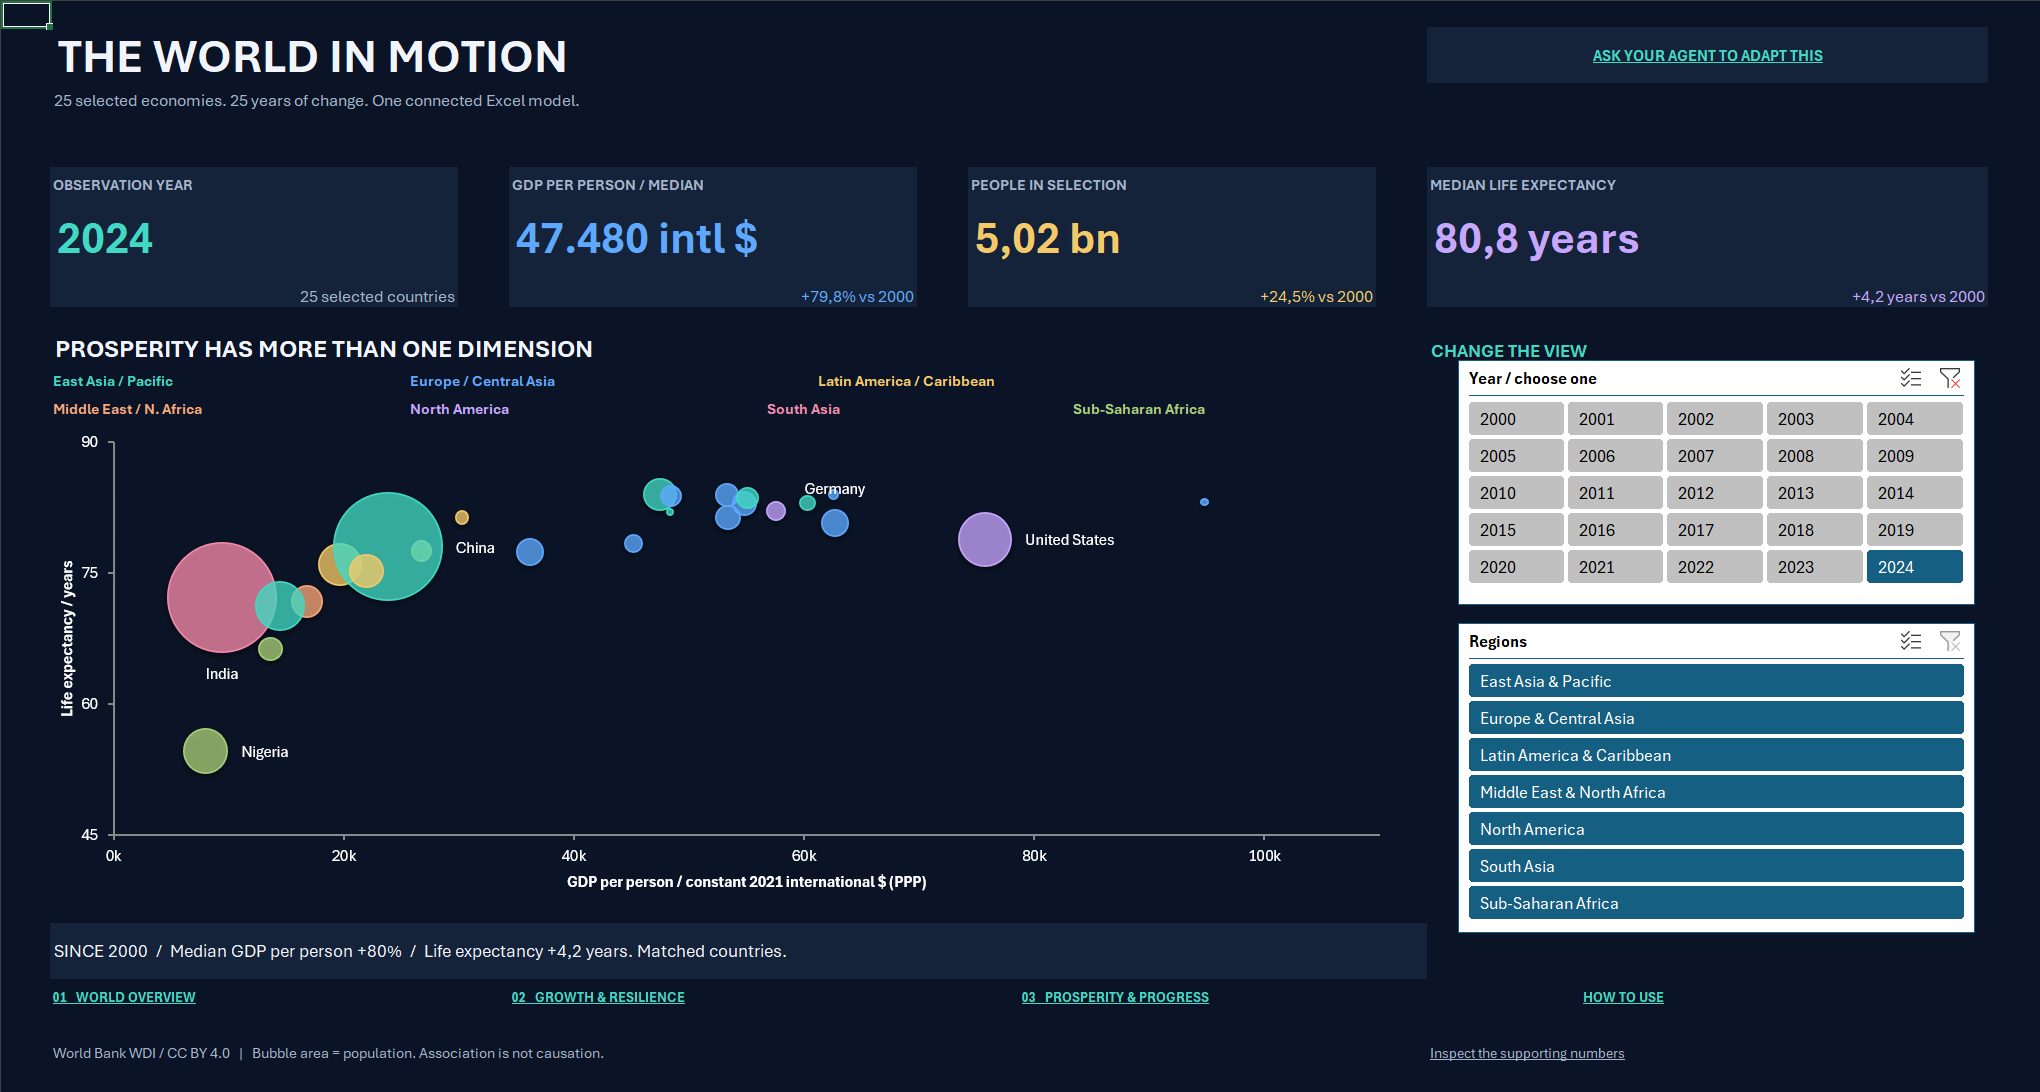
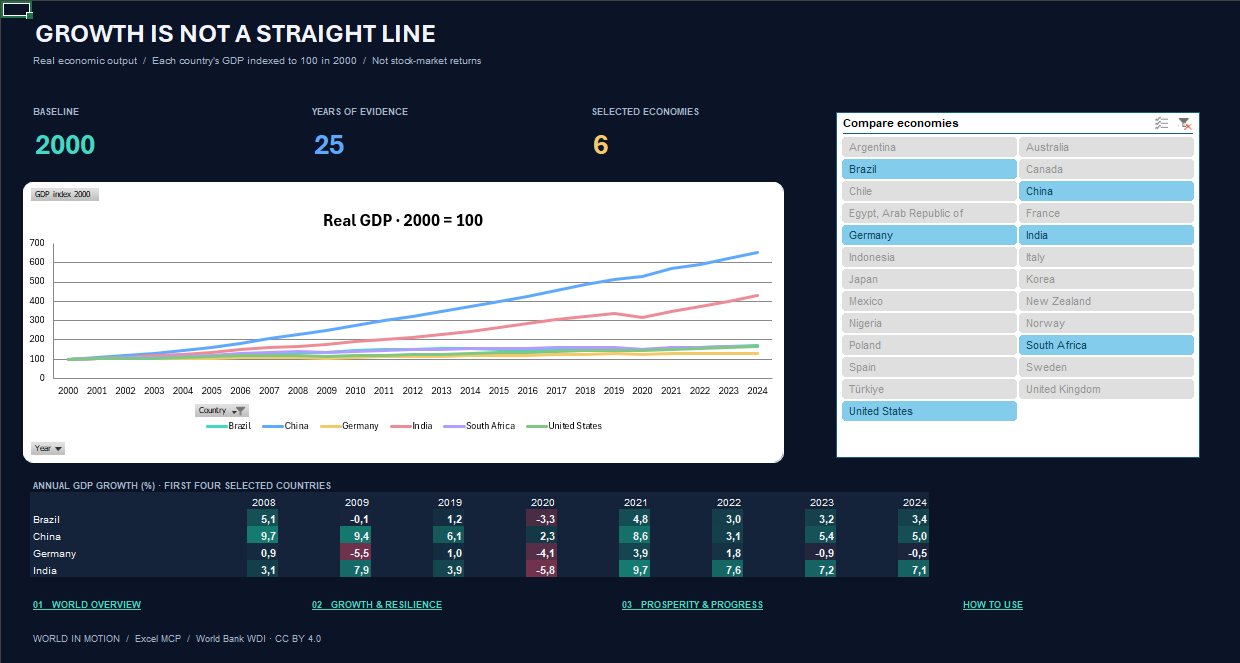
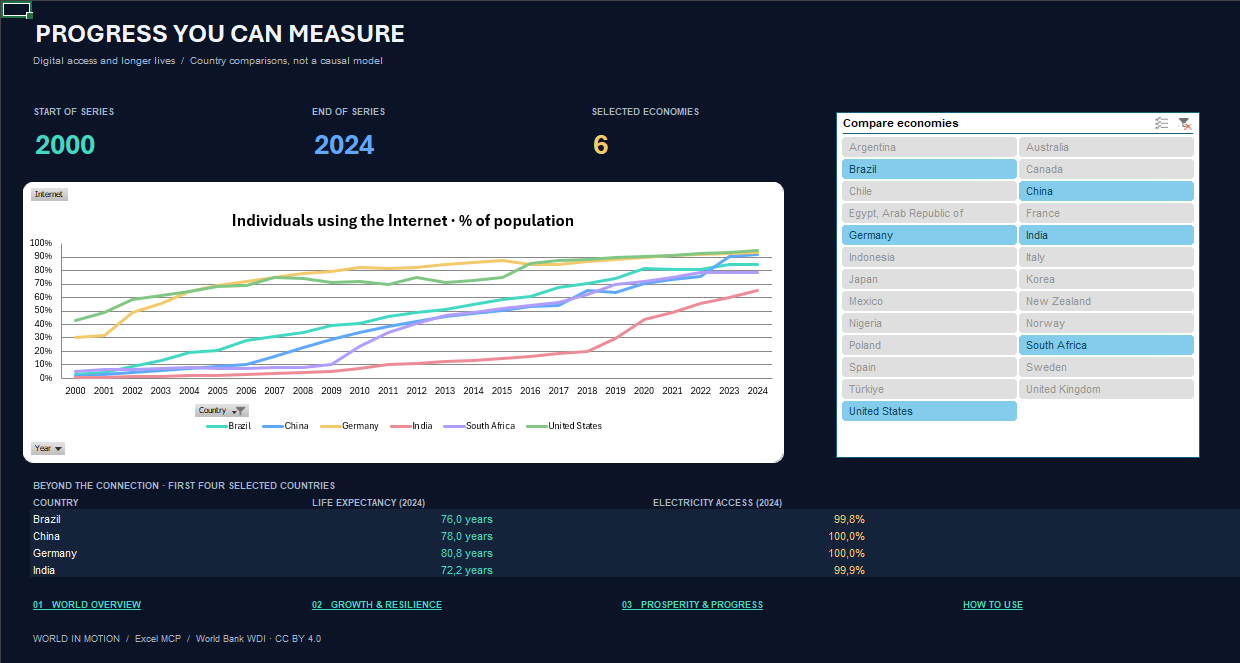
A real, macro-free Excel dashboard built through Excel MCP's excelcli entry point. It compares 25 selected countries, 25 years, and nine World Bank indicators. It is not a global average or an investment comparison.
Make it yours with your agent
Download the workbook, then ask your agent to adapt it through ExcelMCP. You do not need to edit formulas, queries or the Data Model yourself. Use an agent connected to ExcelMCP on Windows with desktop Excel installed. For example:
Open this workbook with ExcelMCP. Compare Germany, France and Italy from 2000 to 2024. Adapt the dashboard for that comparison, retain the original data sources and missing-value handling, and save the changes.
Tell your agent what you want to learn or change. It can inspect the existing model, adjust the analysis and presentation, and verify the results in Excel. This is an example request, not a claim that the sample was built in one prompt.
Explore the workbook
Open world-in-motion.xlsx in Microsoft 365 desktop Excel for Windows. The saved data, Data Model, PivotTables, charts, and slicers work without Python, Excel MCP, an API key, or an internet connection. Other spreadsheet applications may not support the model and slicers. Follow your organisation's normal rules for opening downloaded files; the workbook contains no macros.
| Page | Question | Controls |
|---|---|---|
| World Overview | How do income, life expectancy, and population compare? | Select one year and one or more regions. Bubble area represents population. |
| Growth & Resilience | How has real economic output changed since 2000? | Select countries. The chart starts each country at 100; the heatmap shows annual growth for the first four selected countries. |
| Prosperity & Progress | How has internet use changed, and where are countries now? | Select countries. The summary shows 2024 life expectancy and electricity access for the first four selected countries. |
World Overview uses consistent region colors and labels five reference countries. Its four headline cards show the selected year, median GDP per person, population and median life expectancy. The comparisons with 2000 and the short takeaway update with the filters. Each comparison uses countries with observations in both years for that metric; it does not fill missing values with zero.
Use Ctrl-click or Excel's slicer multi-select button to select several countries. The filter-clear button restores all countries. The default trend comparison is Brazil, China, Germany, India, South Africa, and the United States.
The Start Here tab explains definitions and limitations. Supporting sheets remain visible so readers can inspect the data and calculations. The selectors on one dashboard do not silently change the other two dashboards.
What is inside?
- An embedded, attributed snapshot with 5,625 observations, including 46 explicitly missing values.
- Separate Power Query sources for the saved snapshot and the official online dataset. No creator-specific source paths or credentials.
- A related Data Model: observations, countries, indicators, and years.
- DAX calculations, three native model-backed PivotTables, two linked PivotCharts, a population-sized bubble chart, four slicers, and conditional formatting.
- Live worksheet formulas for the summary cards and comparison tables.
All workbook construction and validation use the supported product commands and installed Excel. Python only prepares the public CSV data and calls the CLI; it does not read or write Excel's internal file format.
Optional online refresh
Normal exploration needs no refresh. A live refresh downloads the official WDI bulk archive, approximately 283 MB, and can take several minutes.
Ask your ExcelMCP-connected agent:
Switch the Observations query from EmbeddedSnapshot to WorldBankLive. Refresh it, wait for completion, then refresh the PivotTables. Check Start Here > Last successful source and verify the loaded observations and results before saving. Explain any data revisions or refresh errors.
To restore the published snapshot, ask your agent to switch back to EmbeddedSnapshot and refresh the query and PivotTables again.
The two sources are deliberately separate: refreshing public data does not combine it with workbook contents or send workbook data to the World Bank. Do not disable Excel privacy protections. If Excel requests source credentials, the World Bank endpoint is public; no API key is supplied by this sample. If a refresh fails, the previous data is not evidence of a successful update.
The live loader checks indicator licences, row coverage, duplicate observation keys, numeric types, and archive structure. It fails rather than silently accepting an unsupported archive or a changed licence. WDI may revise past values; the live edition need not equal the published snapshot.
Sources and interpretation
Source: World Bank, World Development Indicators. All nine selected indicators are labelled CC BY-4.0 in the downloaded WDISeries.csv. See the source manifest for the retrieval date, archive SHA-256, source URLs, exact coverage, and attribution, and indicator metadata for original definitions, providers, limitations, and aggregation methods. The same metadata is embedded in the workbook's Indicator Notes tab, so it travels with the standalone download.
Data is licensed under CC BY 4.0. We selected countries, years, and indicators, reshaped the observations, and added calculations and visualisations. The World Bank has not endorsed the sample. Code follows the repository's licence; that does not replace the data licence.
Important limitations:
- "Income" means GDP per person at purchasing-power parity, in constant 2021 international dollars. It is not salary or disposable household income.
- The income card is an unweighted country median, not a population-weighted estimate or an official World Bank region average.
- The life expectancy card is also an unweighted country median. Changes since 2000 compare medians over matched countries, not the median of individual countries' percentage changes. Population changes compare matched sums.
- GDP uses constant 2015 US dollars. The growth index divides each country's GDP by its own 2000 value and multiplies by 100; it is not a stock-market return.
- Growth and inflation values are already in percent units:
5means 5%. - Missing observations remain blank. They are not interpolated or filled with zero. Multiple selected overview years produce instructions rather than misleading population totals.
- Country names, regions, and income groups use the downloaded classifications, not historical classifications. The 25 countries are not representative of every country in the world.
- A cross-country association does not establish cause and effect. Internet use is not a measure of affordability or connection quality.
Rebuild and check
Use Windows, desktop Excel, Python's standard library, and a built excelcli. Run Excel operations sequentially and keep logs outside the repository. The data CSVs are included; downloading the large archive is only needed to prepare a different snapshot.
$cli = ".\src\ExcelMcp.CLI\bin\Release\net10.0-windows\excelcli.exe"

## The destination must not already exist.
python .\samples\world-bank-dashboard\build_workbook.py `
  --cli $cli --output C:\Temp\world-in-motion.xlsx `
  --logs C:\Temp\world-in-motion-build

python -m unittest discover -s .\samples\world-bank-dashboard -p "test_*.py"

python .\samples\world-bank-dashboard\validate_workbook.py `
  --cli $cli --workbook C:\Temp\world-in-motion.xlsx `
  --logs C:\Temp\world-in-motion-check

## Optional: also exercise the real online refresh.
python .\samples\world-bank-dashboard\validate_workbook.py `
  --cli $cli --workbook C:\Temp\world-in-motion.xlsx `
  --logs C:\Temp\world-in-motion-live-check --live
To apply only the World Overview design and agent instructions to an existing sample, use build_workbook.py --overview-only with the same --cli, --output and --logs arguments. It keeps the other two dashboards, data sources and model intact.
The Excel check compares all loaded snapshot values and 625 country-year model results with independent calculations, checks chart data bindings, changes filters, exercises the multi-year guard, makes the online source unavailable while refreshing the snapshot, and captures all three dashboards. It closes without saving its temporary test changes. The optional live check flags changed missing-value coverage for review rather than updating the published fixture.
To extract a new snapshot, download the archive from the exact URL recorded in data/sources.json, then run:
python .\samples\world-bank-dashboard\prepare_data.py C:\Temp\WDI_CSV.zip `
  --output C:\Temp\wdi-data --retrieved YYYY-MM-DD
Use the actual retrieval date and review the licences and results before replacing the published data. Do not add the full source archive to the repository.