World Bank Briefing: Excel to PowerPoint
Watch the video
Agentic Workflow: One AI Agent Turns World Bank Data into Excel and PowerPoint - one request to GitHub Copilot CLI with Claude Opus 5.5, using Excel MCP Server and PowerPoint MCP Server.
Watch on YouTube (2:41), with English captions.
Get the files
Download the Excel workbook Download the PowerPoint briefing
Download the Excel workbook · Download the PowerPoint briefing
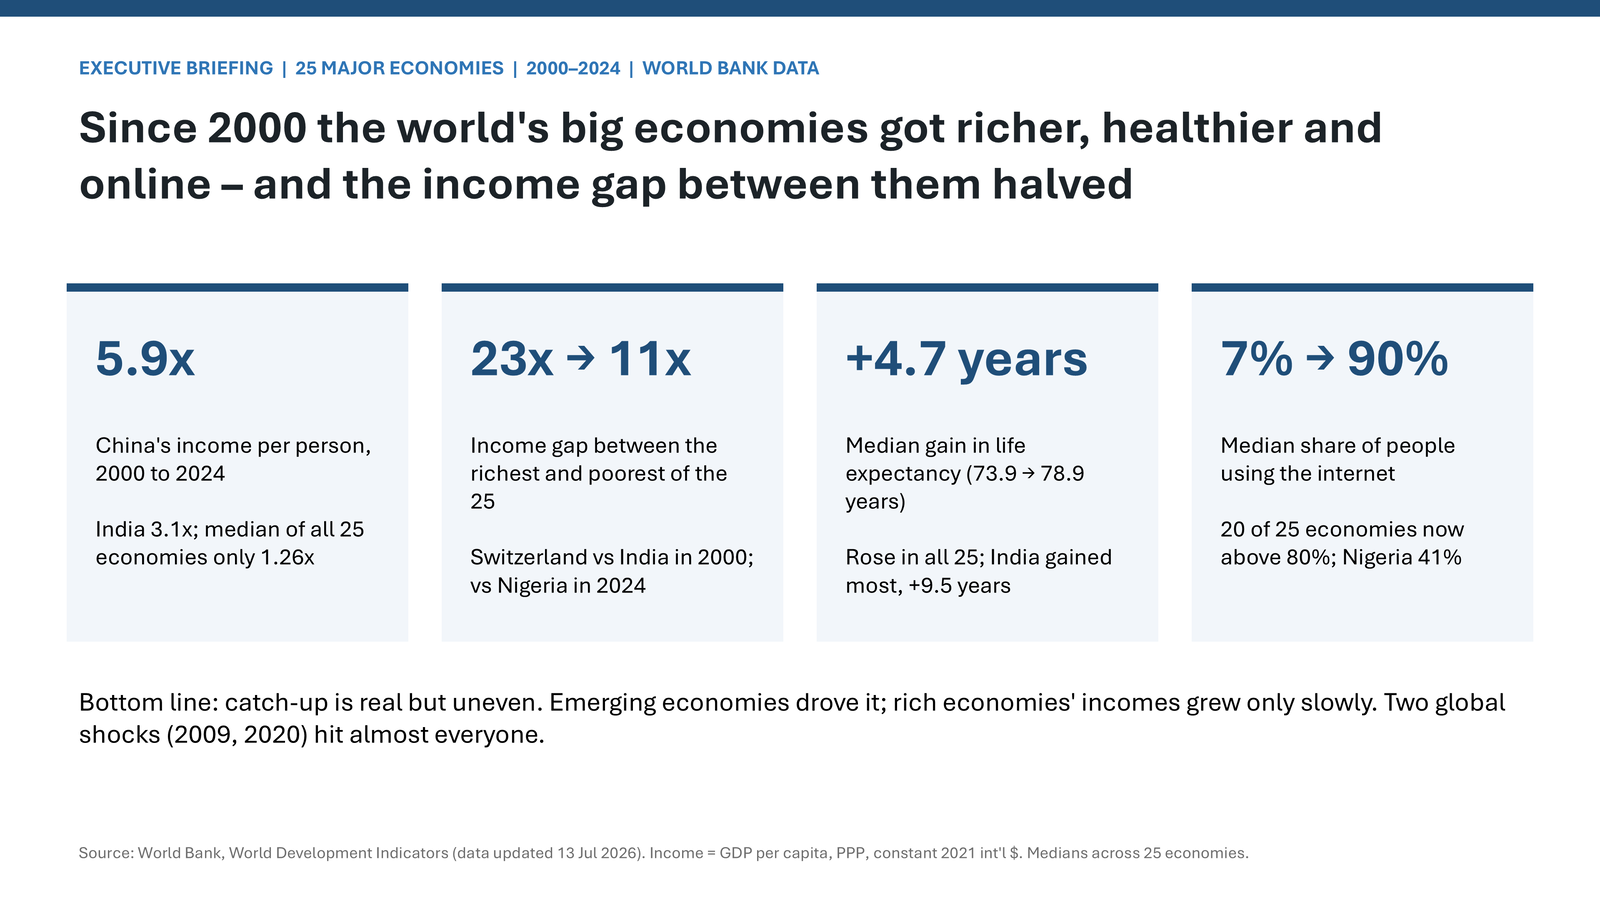
One AI agent built both files from a single plain-English request. It found the World Bank data, built a refreshable, checked Excel analysis with Excel MCP Server, then designed a 7-slide executive briefing from that workbook with PowerPoint MCP Server. Nobody touched Excel or PowerPoint during the run.
The files are published exactly as the agent saved them. The only change is that personal details (the author name) were removed from the file properties.
The request
This was the only message the agent received: one prompt of 112 words, with no follow-up messages, approvals or corrections.
Research World Bank data on how 25 major economies developed from 2000 to 2024: income per person, economic growth, life expectancy and internet use. Use the official World Development Indicators.
With Excel MCP, build a refreshable Excel analysis in this folder: load the data with Power Query, model it, add a few clear charts, and check the key numbers.
Then, as an expert in executive presentations, use PowerPoint MCP to build a 7-slide briefing of the highlights: one insight per slide with a headline that states it, native charts with numbers from the workbook, sources and caveats, and speaker notes. Export each slide and check it visually. Keep Excel and PowerPoint visible.
How long it took
Measured from the screen recording and the agent's session record:
| Measure | Result |
|---|---|
| Human input | 1 prompt, 112 words, 0 follow-ups |
| Time from prompt to finished deck | 38.6 minutes |
| Tool calls by the agent | 612: 182 Excel MCP Server, 372 PowerPoint MCP Server, 58 other (web, shell, files) |
| Workbook checks | 19 of 19 pass |
Setup: GitHub Copilot CLI in autopilot mode, Claude Opus 5.5, Excel MCP Server 2.3.3, PowerPoint MCP Server 0.3.1, Microsoft 365 desktop Excel and PowerPoint on Windows.
The run was not perfect. A PowerPoint chart data window got stuck open (PowerPoint MCP Server issue #108), then PowerPoint crashed: slide 4's chart and all of slide 5 were lost. The agent reopened the deck and rebuilt what was lost, without help. 16 Excel and PowerPoint tool calls returned errors; the agent adjusted and carried on. We filed the problems we found as issues, including Excel MCP Server #1072 and #1073.
After the run, we recalculated every headline number on the slides from the live World Bank API ourselves; they all match. You should still review an agent's work before you rely on it.
What is in the workbook?
Open WDI_Development_2000-2024.xlsx in Microsoft 365 desktop Excel for Windows. It contains no macros.
| Sheet | Contents |
|---|---|
| About | What each sheet contains |
| Dashboard | Four charts: income growth, growth and shocks, life expectancy gains, internet use |
| Highlights | Every headline number used in the deck, calculated live from the data |
| Analysis | One row per economy: start and end values and change; change the years in B2 and D2 |
| Trends | One row per year: medians across the 25 economies, plus selected countries |
| Model | A PivotTable on the Data Model, with DAX measures |
| Checks | Source details and 19 pass/fail checks |
| Data, WDI_Long, Lookups | The Power Query results |
- Power Query loads the data straight from the public World Bank API: four indicators, 25 economies, 2000–2024 (2,497 values).
- The Data Model relates observations, countries and indicators, with six DAX measures.
- The 19 checks cover row counts, formula errors, Data Model versus worksheet formulas, and a separate download of key numbers from the API.
To get the latest data, refresh all (Data > Refresh All). This needs an internet connection and no API key. The World Bank revises past values, so a refresh can change the numbers, and the "independent snapshot" checks may then fail on purpose until you review the changes.
What is in the briefing?
WDI_Briefing_2000-2024.pptx has seven slides. Each headline states one insight; each data slide shows its source and the workbook cells it came from; every slide has speaker notes.
- Executive summary: richer, healthier, online, and the income gap halved.
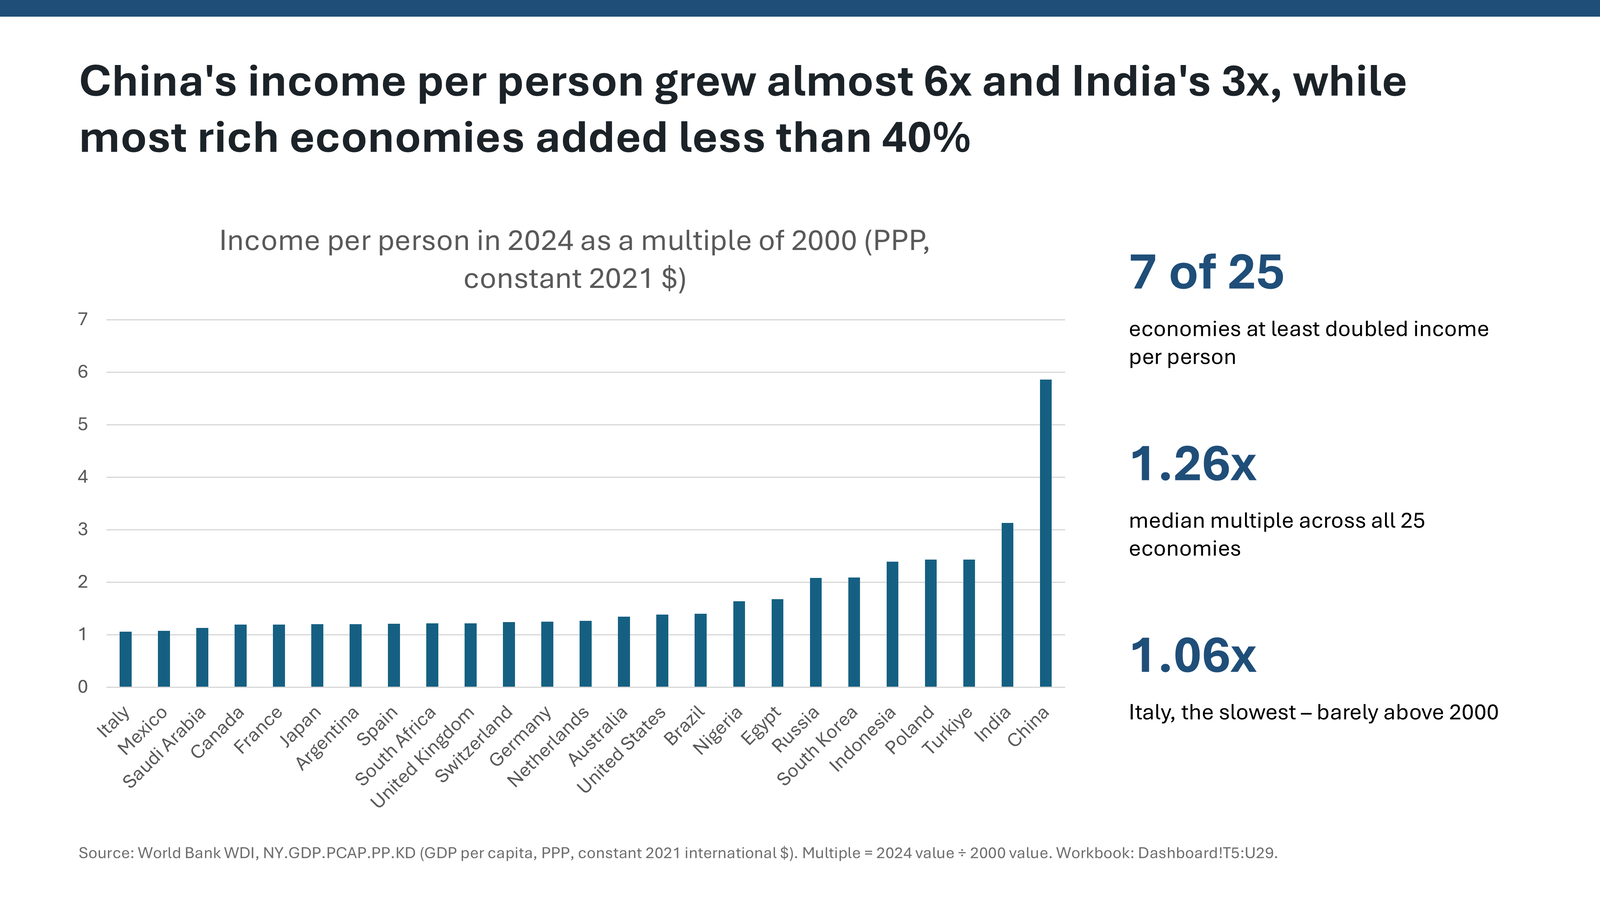
- China's income per person grew almost 6x and India's 3x.
- The gap between the richest and poorest of the 25 halved, from 23x to 11x.
- Two global shocks: 17 of 25 economies shrank in 2009, and 22 in 2020.
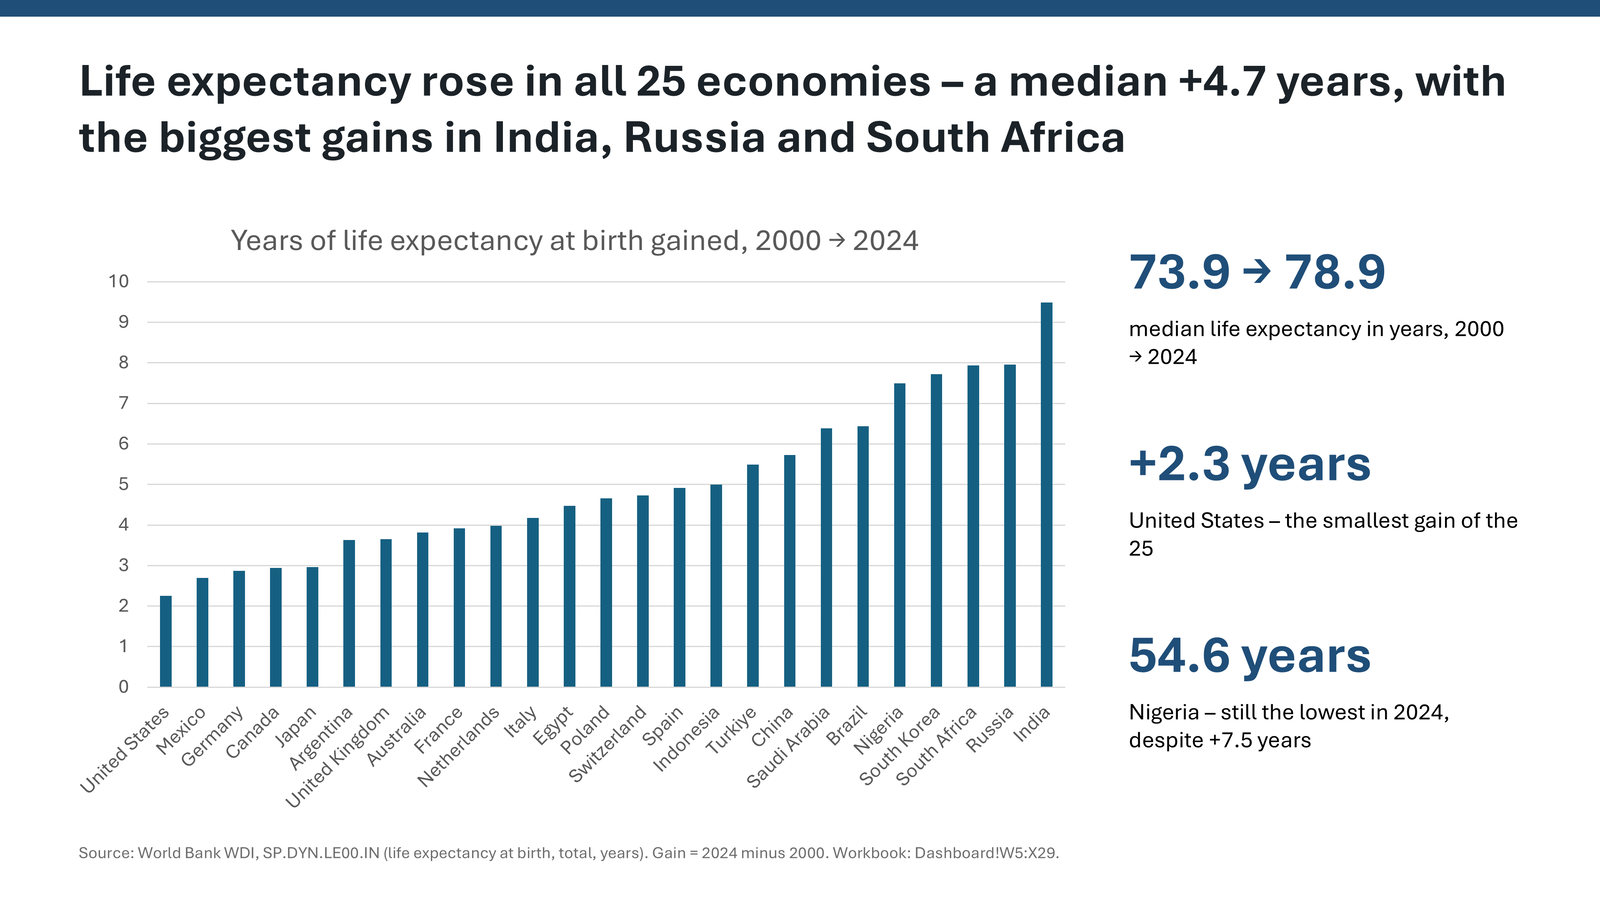
- Life expectancy rose in all 25, by a median of 4.7 years.
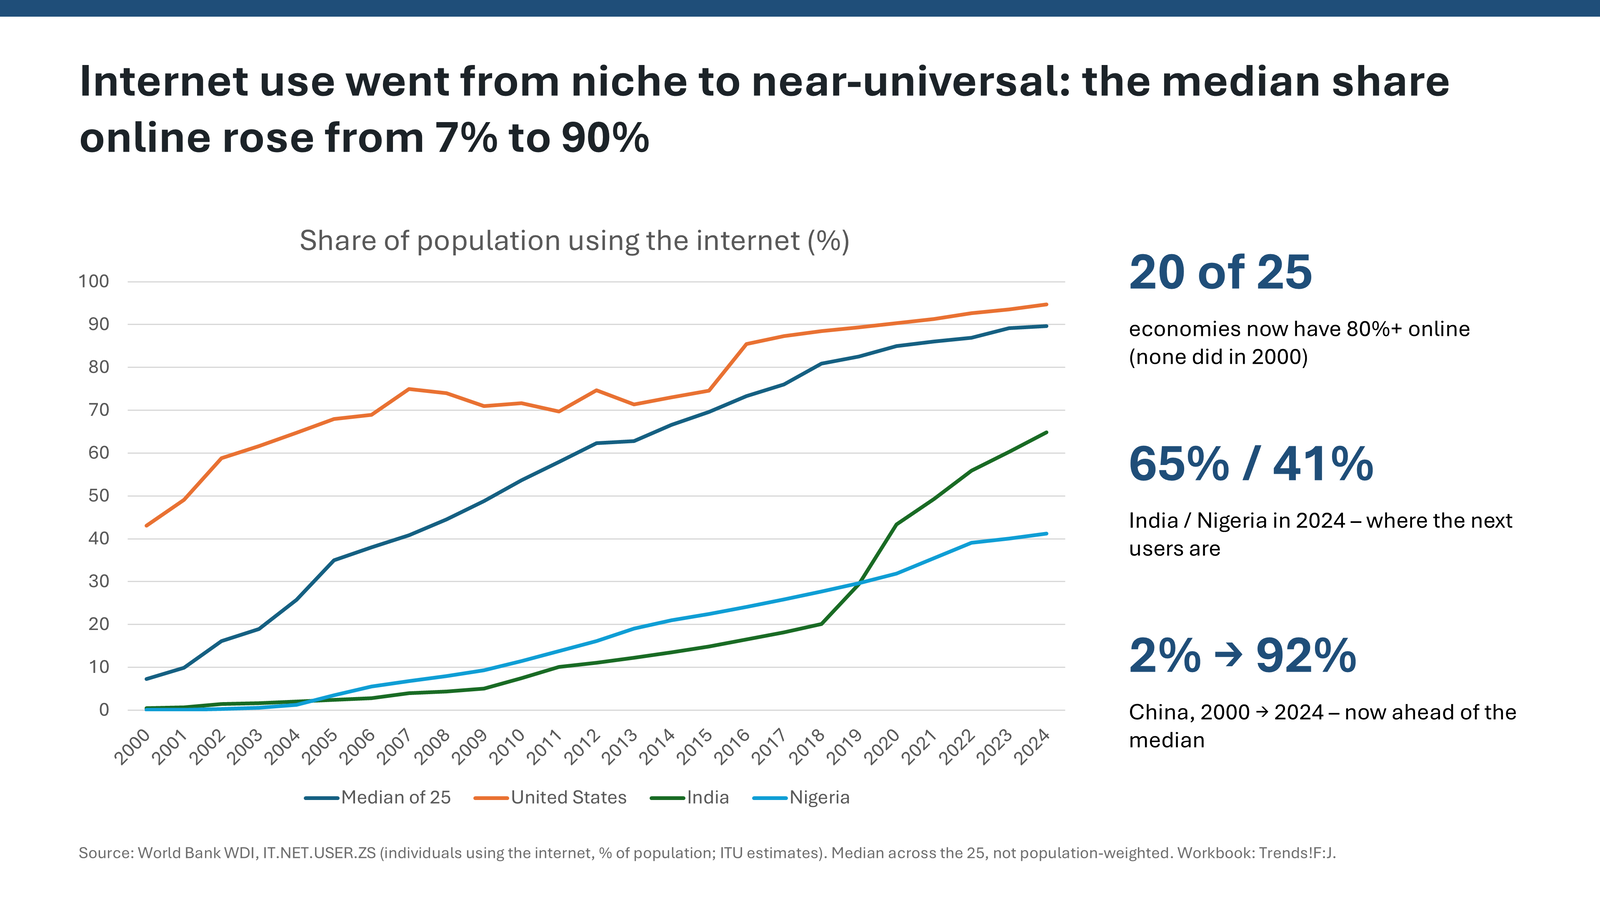
- Internet use went from 7% to 90% (median).
- What it means, plus sources and caveats.
The charts are native, editable PowerPoint charts. Their numbers were copied from the workbook; they are not linked to it, so refreshing the workbook does not update the deck.
Make it yours with your agent
Connect your agent to Excel MCP Server and PowerPoint MCP Server on Windows, with desktop Excel and PowerPoint installed. Then ask, for example:
Open WDI_Development_2000-2024.xlsx with Excel MCP. Refresh the data and show me which checks fail and why. Then update WDI_Briefing_2000-2024.pptx with PowerPoint MCP so every number matches the refreshed workbook.
Sources and limitations
Source: World Bank, World Development Indicators (data updated 13 July 2026). Indicators: NY.GDP.PCAP.PP.KD, NY.GDP.MKTP.KD.ZG, SP.DYN.LE00.IN and IT.NET.USER.ZS.
Data is licensed under CC BY 4.0. The agent selected the economies, years and indicators, and added calculations, charts and text. The World Bank has not endorsed this sample.
- "Income" means GDP per person at purchasing-power parity, in constant 2021 international dollars. It is not salary or household income.
- Medians are across the 25 economies and are not weighted by population or GDP. National averages hide inequality within countries.
- The 25 economies were chosen to span regions and income levels; they do not represent every country.
- 2024 values are provisional, and purchasing-power estimates are revised when new price surveys arrive.
- Missing values stay blank (Australia's internet use, 2002–2004).
- The slides describe what changed. They do not claim what caused it.