Skip to content

Complete Feature Reference

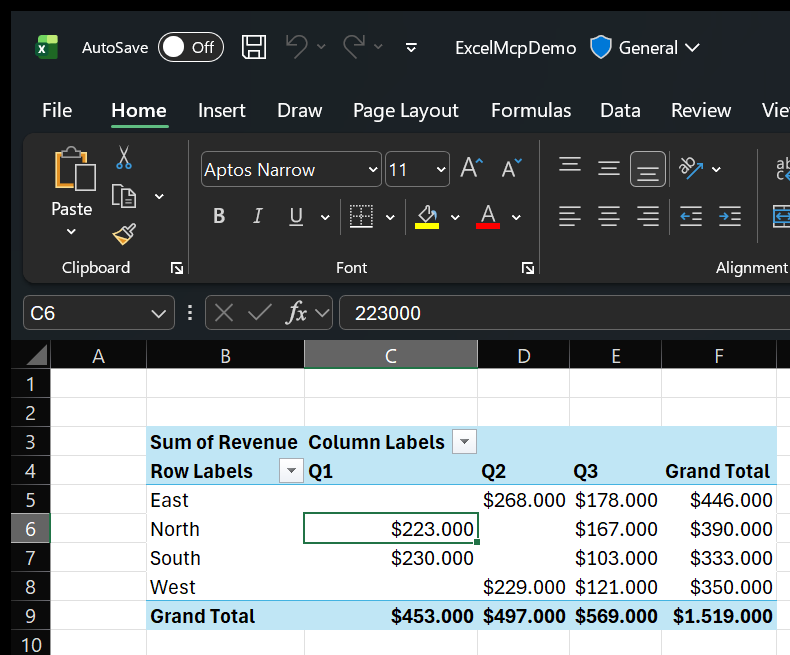
A PivotTable summarizing revenue by region and quarter, built in the real Excel app by Excel MCP Server
A PivotTable — revenue by region and quarter with grand totals — created in the real Excel application from a plain-language request.

New to Excel MCP Server? You don't need to learn these operations — your AI assistant picks the right tool for what you ask in plain language. This page is the full reference. The tools most people reach for first:

  • powerquery — import and reshape data from files, databases, and APIs
  • range / range_format — read and write cell values, formulas, and formatting
  • pivottable — summarize and analyze data
  • chart — visualize results
  • datamodel — build a Power Pivot model with DAX measures
  • vba — run macros and scripted automation

Every tool below lists its operations grouped by category. Use the "On this page" menu to jump to a specific tool.


📁 File Operations (6 operations)

Open, create, and close Excel workbooks. Every other tool works on a session opened here.

Operations: - List Sessions: View all active Excel sessions - Open: Open workbook and create session (returns session ID for all subsequent operations). IRM/AIP-protected files are automatically detected and opened read-only with Excel visible for credential authentication — no extra parameters needed. - Close: Close session with optional save - Close Workbook: Close workbook without closing Excel - Create Empty: Create new .xlsx or .xlsm workbook - Test: Verify workbook can be opened and is accessible. Returns isIrmProtected flag for IRM/AIP-protected files.


🧮 Calculation Mode (3 operations)

Control when and how Excel recalculates formulas — useful for speeding up bulk edits.

Operations: - Get Mode: Query current calculation mode and calculation state - Set Mode: Switch between automatic, manual, and semi-automatic modes - Calculate: Explicitly recalculate workbook, sheet, or range


🔄 Power Query & M Code (12 operations)

Import, transform, and refresh data with Power Query. Every operation is a single-call atomic workflow.

Discovery: - List: List all Power Query queries in workbook - View: View the M code of a Power Query - Get Load Config: Get current load configuration

Lifecycle: - Create: Import + load in one operation (atomic workflow), preserving M code by default - Update: Update M code, preserving M code by default, with optional auto-refresh - Rename: Rename a Power Query (trim + case-insensitive uniqueness check) - Unload: Remove data from all destinations (keeps query definition) - Delete: Remove Power Query from workbook

Loading & Refresh: - Refresh: Refresh a Power Query with timeout detection - Refresh All: Batch refresh all queries in workbook - Load To: Configure load destination and refresh (atomic)

Advanced: - Evaluate: Execute M code directly and return results (without creating a permanent query)

Notes: - M-code formatting: M code is preserved exactly by default. Create and Update can opt in to remote formatting with formatMCode=true, which sends M code to powerqueryformatter.com and adds network latency. If remote formatting fails, the original M code is saved unchanged.


📊 Data Model & DAX (Power Pivot) (19 operations)

Build a Power Pivot Data Model — manage tables, DAX measures, and relationships, then query it.

Tables & Columns: - List Tables: Discover all tables in the Data Model - Read Table: Get specific table information - Rename Table: Rename a Data Model table (best-effort via Power Query; returns clear error if not supported) - Delete Table: Remove table from Data Model - List Columns: List columns for a table - List Workbook Connections: List Power Query sources available for integration

Measures: - List Measures: List all DAX measures with formula previews - Create Measure: Create new DAX measure, preserving DAX by default (format types: Currency, Percentage, Decimal, General) - Update Measure: Modify existing measure, preserving DAX by default - Delete Measure: Remove measure from model

Relationships: - List Relationships: View all table relationships - Read Relationship: Get specific relationship info - Create Relationship: Create relationship between tables - Update Relationship: Modify relationship (toggle active/inactive) - Delete Relationship: Remove relationship

Model & Queries: - Read Info: Get comprehensive model information - Refresh: Refresh entire Data Model - Evaluate: Execute DAX EVALUATE queries and return tabular results (for ad-hoc analysis) - Execute DMV: Execute SQL-like DMV (Dynamic Management View) queries for metadata discovery

Notes: - DAX formatting: DAX formulas are preserved exactly by default, subject to Excel locale separator translation. CreateMeasure and UpdateMeasure can opt in to remote formatting with formatDax=true, which sends DAX to daxformatter.com and adds network latency. If remote formatting fails, the original DAX is saved unchanged. - DAX calculated columns are not supported — use the Excel UI for calculated columns.


📇 Excel Tables (ListObjects) (27 operations)

Create and manage Excel Tables (ListObjects) — structured ranges with styling, filtering, and sorting.

Lifecycle: - List: List Excel Tables in a worksheet or workbook - Read: Get table structure (columns, range, style) - Create: Create a new Excel Table from a range - Rename: Rename an existing table - Resize: Resize table range to match new data bounds - Delete: Remove a table (keeps underlying cell data)

Styling & Formatting: - Apply Style: Apply a built-in table style - Toggle Totals Row: Show/hide the totals row - Set Column Totals: Configure per-column total function (Sum, Average, Count, etc.)

Data Operations: - Append Rows: Add rows to the end of a table - Get Table Data: Read table data as a 2D array, with optional visible-only filtering - Add to Data Model: Load a table into the Power Pivot Data Model

DAX-Backed Tables: - Create from DAX: Create an Excel Table populated by a DAX EVALUATE query - Update DAX: Change the DAX query of an existing DAX-backed table - Get DAX: Retrieve the DAX query info from a table

Filter Operations: - Apply Filter (Criteria): Filter a column using comparison criteria - Apply Filter (Values): Filter a column to a specific set of values - Clear Filters: Remove all active filters - Get Filter State: Read current filter criteria

Column Management: - Add Column: Insert a new column - Remove Column: Delete a column - Rename Column: Rename a column header

Structured References: - Get Structured Reference: Get formula syntax for a table column or range

Sorting: - Sort (Single Column): Sort by one column - Sort (Multi-Column): Sort by up to 3 columns/levels

Number Formatting: - Get Column Number Formats: Read number formats applied to columns - Set Column Number Formats: Apply number formats to columns


📈 PivotTables (30 operations)

Create and configure PivotTables from ranges, Excel Tables, or the Data Model.

Creation: - Create from Range: Build a PivotTable from a cell range - Create from Excel Table: Build a PivotTable from an Excel Table - Create from Data Model: Build an OLAP PivotTable from the Data Model

Field Management: - List Fields: List all fields across row, column, value, and filter areas - Add Row Field / Column Field / Value Field / Filter Field: Add a field to the given area - Remove Field: Remove a field from the PivotTable

Field Configuration: - Set Field Function: Set aggregation function (Sum, Average, Count, Min, Max, etc.) - Set Field Name: Set a custom display name for a field - Set Field Number Format: Apply a number format to a value field - Set Field Filter: Apply filter criteria to a field - Sort Field: Sort a field ascending/descending

Calculated Fields (Regular PivotTables): - List Calculated Fields: List calculated fields on a regular PivotTable - Create Calculated Field: Add a calculated field - Delete Calculated Field: Remove a calculated field

Calculated Members (OLAP/Data Model PivotTables): - List Calculated Members: List calculated members on an OLAP PivotTable - Create Calculated Member: Add a calculated member - Delete Calculated Member: Remove a calculated member

Layout & Formatting: - Set Layout: Switch between table and outline layout - Set Subtotals Display: Show/hide subtotals - Set Grand Totals Display: Show/hide grand totals

Data Operations: - Get PivotTable Data: Read PivotTable data as a 2D array - Refresh: Refresh the PivotTable from its source

Lifecycle: - List: List PivotTables in a worksheet or workbook - Read: Get PivotTable info - Delete: Remove a PivotTable


📉 Charts (29 operations)

Create and format charts and PivotCharts, with full control over series, axes, labels, and trendlines.

Creation: - Create from Range: Build a chart from a cell range - Create from PivotTable: Build a chart from a PivotTable

Series Management: - Add Series: Add a data series to a chart - Remove Series: Remove a data series - Update Series Data: Change the data range for a series

Configuration: - Set Data Source: Change the chart's source range - Set Chart Type: Change the chart type (bar, line, pie, etc.) - Show/Hide Legend: Toggle the legend - Set Style: Apply a built-in chart style

Formatting: - Set Chart Title: Set or clear the chart title - Set Axis Title: Set or clear an axis title - Set Axis Number Format: Apply a number format to an axis - Get Axis Number Format: Read the current axis number format

Data Labels: - Configure Data Labels: Show values, percentages, category names, etc. - Set Label Position: Position labels (Center, InsideEnd, OutsideEnd, etc.) - Apply to Series: Apply label config to all series or a specific one

Axis Scale: - Get Axis Scale: Read current min/max/unit settings - Set Min/Max Scale: Set axis minimum/maximum - Set Major/Minor Units: Set axis tick unit spacing

Gridlines: - Get Gridlines Config: Read current gridline visibility - Set Gridlines: Toggle major/minor gridline visibility

Series Formatting: - Set Marker Style: Set marker shape (Circle, Square, Diamond, Triangle, etc.) - Set Marker Size: Set marker size - Set Marker Colors: Set marker fill/line colors

Trendlines: - Add Trendline: Add a trendline (Linear, Exponential, Logarithmic, Polynomial, Power, MovingAverage) - List Trendlines: List trendlines on a series - Delete Trendline: Remove a trendline - Configure Trendline: Set forecast forward/backward, display equation, display R²

Placement & Positioning: - Set Placement: Move/resize a chart with cell-anchoring options - Fit to Range: Position and size a chart to match a range

Lifecycle: - List: List charts in a worksheet or workbook - Read: Get chart info - Move: Move a chart to a different worksheet or a new sheet - Delete: Remove a chart


📋 Ranges (46 operations)

Read and write cell values, formulas, and formatting across any range of cells.

Formatting split: use range for number display formats such as dates, currency, percentages, and text display. Use range_format for visual styling, validation, auto-fit, and size/layout changes.

Data Operations: - Get/Set Values: Read or write cell values - Get/Set Formulas: Read or write formulas - Clear All/Contents/Formats: Clear a range's contents, formats, or both - Copy / Copy Values / Copy Formulas: Copy a range, or just its values/formulas - Insert/Delete Cells: Shift cells to insert or remove space - Insert/Delete Rows: Insert or delete entire rows - Insert/Delete Columns: Insert or delete entire columns - Find: Search a range for matching values - Replace: Find and replace values in a range - Sort: Sort a range by one or more columns

Discovery & Utilities: - Get Used Range: Get the worksheet's used range - Get Current Region: Get the contiguous data region around a cell - Get Range Info: Get a range's address and dimensions

Hyperlinks: - Add Hyperlink: Add a hyperlink to a cell - Remove Hyperlink: Remove a hyperlink - List Hyperlinks: List all hyperlinks in a range - Get Hyperlink: Get a specific hyperlink's target

Number Formatting (range): - Get Number Formats: Read number formats as a 2D array - Set Number Format: Apply one number format uniformly - Set Number Formats: Apply individual per-cell number formats

Visual Formatting (range_format): - Get Style: Read the applied cell style - Set Style: Apply a built-in Excel style - Format Range: Set font, color, borders, alignment, orientation - Format Ranges: Apply one shared formatting payload to multiple ranges

Data Validation (range_format): - Add Validation: Add dropdown, number/date/text validation rules - Get Validation: Read current validation info - Remove Validation: Remove validation rules

Merge Operations (range_format): - Merge Cells: Merge a range into one cell - Unmerge Cells: Undo a merge - Get Merge Info: Read current merge state

Cell Protection: - Set Lock Status: Lock/unlock cells (effective once the sheet is protected) - Get Lock Status: Read current cell lock status

Auto-Sizing (range_format): - Auto-Fit Columns: Resize columns to fit content - Auto-Fit Rows: Resize rows to fit content


📄 Worksheets (16 operations)

Add, rename, move, and manage worksheets — including tab colors and visibility.

Lifecycle: - List: List worksheets in the workbook - Create: Add a new worksheet - Rename: Rename a worksheet - Copy: Copy a worksheet within the workbook - Move: Move a worksheet within the workbook - Delete: Remove a worksheet

Cross-Workbook Operations: - Copy to File: Copy a worksheet to another workbook (atomic) - Move to File: Move a worksheet to another workbook (atomic)

Tab Colors: - Set Tab Color: Set a worksheet tab's RGB color - Get Tab Color: Read the current tab color - Clear Tab Color: Reset the tab to its default color

Visibility: - Show: Make a worksheet visible - Hide: Hide a worksheet (still shown in the Unhide dialog) - Very Hide: Hide a worksheet from the Excel UI entirely - Get Visibility: Read the current visibility status - Set Visibility: Set visibility status directly


🔌 Data Connections (9 operations)

Create and refresh external OLEDB/ODBC data connections.

Operations: - List: View all data connections - View: Get connection details - Create: Create OLEDB/ODBC connections (requires provider installed) - Test: Verify connection validity - Refresh: Refresh connection data - Delete: Remove connection - Load To: Load connection data to worksheet (when supported) - Get Properties: Get connection string and metadata - Set Properties: Update connection string, command text, and settings

Notes: - Supported types: OLEDB (requires Microsoft.ACE.OLEDB.16.0 or similar), ODBC (requires ODBC driver installed), and Power Query connections (atomic redirect to powerquery). - Automatic fallback: TEXT/WEB connections automatically redirect to powerquery for reliable imports.


🏷️ Named Ranges (Parameters) (6 operations)

Manage named ranges — ideal for driving workbook parameters that Power Query and formulas react to.

Operations: - List: List visible user-defined named ranges with references; hidden/internal Excel names (including Power Query ExternalData_* and AutoFilter names) are omitted before value inspection, and large ranges return metadata without materializing values - Read: Get value of a named range - Write: Set value of a named range (ideal for parameter automation) - Create: Create new named range - Update: Modify existing named range - Delete: Remove named range

Notes: - Use cases: Manage workbook parameters without touching worksheets. Ideal for automation — update a parameter and Power Query refreshes automatically.


📝 VBA Macros (6 operations)

View, import, edit, and run VBA code in .xlsm workbooks.

Operations: - List: List VBA components and discovered procedures - View: Display component code without exporting - Import: Create a new standard module from code or file input - Update: Replace code in an existing VBA component - Delete: Remove a VBA component by name - Run: Execute a procedure with optional string parameters

Notes: - Procedural/module-focused VBA support for .xlsm workbooks. - Requires the manual VBA trust prerequisite in Excel (no trust-configuration command). - Import creates standard modules; list/view also cover class, form, and document components.


🔪 Slicers (8 operations)

Add interactive slicers to filter PivotTables and Excel Tables visually.

PivotTable Slicers: - Create Slicer: Add slicer for PivotTable field with optional position - List Slicers: List all PivotTable slicers in workbook - Set Selection: Filter PivotTable by slicer selection (single or multi-select) - Delete Slicer: Remove PivotTable slicer

Table Slicers: - Create Table Slicer: Add slicer for Excel Table column - List Table Slicers: List all Table slicers in workbook - Set Table Selection: Filter Table by slicer selection - Delete Table Slicer: Remove Table slicer

Notes: - Use cases: Interactive data filtering without modifying PivotTable/Table structure, dashboard creation with visual filter controls, and multi-slicer filtering for complex data analysis.


🌈 Conditional Formatting (4 operations)

Apply rule-based formatting that highlights cells based on their values.

Operations: - Add Rule: Create a conditional formatting rule — cell value comparison (>, <, =, etc.), expression-based formula (custom DAX/Excel formula), or color scale/data bar/icon set - Clear Rules: Remove formatting from ranges - List Rules: Read existing conditional formatting rules for a range — returns rule type, operator, formulas, applies-to range, priority, and formatting (interior/font/borders) with colors as #RRGGBB hex - List Worksheet Rules: Read all conditional formatting rules across an entire worksheet, each with its applies-to range, in priority order


📸 Screenshot (2 operations)

Capture ranges or worksheets as PNG images using Excel's own rendering.

Operations: - Capture Range: Capture a specific range as a PNG image - Capture Sheet: Capture the entire used area of a worksheet as a PNG image, using Excel's built-in rendering (CopyPicture) — captures formatting, charts, and conditional formatting. MCP returns the image directly as ImageContent (base64 PNG); CLI returns JSON with base64-encoded image data.


🐍 Python in Excel (2 operations)

Write and read =PY() formulas that run in Excel's cloud Python engine.

Operations: - Set Formula: Write a =PY("<code>", returnType) formula via Range.Formula2. returnType 0 = "Excel Value" (a plain value/array), 1 = "Python Object" (a rich data type card, e.g. a DataFrame). Must always be passed explicitly — omitting it causes a #NAME? error. - Get Result: Read back the computed value, polling briefly since cloud execution is not instantaneous. Best-effort: Excel exposes no reliable "still computing" signal via COM, so a freshly written formula may read back as unconverged; if the poll doesn't stabilize in time, the call reports failure and asks the caller to retry rather than guessing at a stale value.

Notes: - Requires: a real Excel session signed into a licensed Microsoft 365 account with Python in Excel enabled, plus internet access — the Python code executes in a Microsoft-hosted cloud sandbox, not locally. Not available offline or with perpetual-license Excel. - Data binding: Reference live worksheet data inside the Python code with xl("A1:A6"), xl("Sheet1!A1:A6"), or a named range xl("MyRange") — works the same as if typed interactively.


🪧 Window Management (9 operations)

Show, position, and arrange the Excel window — great for watching the AI work in real time.

Visibility & Focus: - Show: Make Excel visible and bring it to the foreground - Hide: Hide the Excel window - Bring to Front: Bring Excel to the foreground without changing visibility

Window State & Layout: - Get Info: Get current window state (visibility, position, size, foreground status) - Set State: Set window state to normal, minimized, or maximized - Set Position: Set window position and size in points (left, top, width, height) - Arrange: Arrange the Excel window using preset layouts

Status Bar: - Set Status Bar: Display custom text in Excel's status bar for real-time feedback - Clear Status Bar: Restore the default status bar text

Notes: - Arrange presets: left-half / right-half (side-by-side with other applications), top-half / bottom-half (stacked view), center (centered window, 60% of screen), and full-screen (maximized). - Use cases: Interactive "agent mode" where users watch Excel respond to AI commands in real time, side-by-side layouts (Excel on one half, AI assistant on the other), and visibility changes that are reflected in session metadata.


🔧 Tool Selection Quick Reference

Task Tool
Import data powerquery or connection
Create analysis pivottable (data model-based for OLAP)
Visualize data chart
Update parameters namedrange (write operation)
Manage formulas range (set-formulas)
Format data range / range_format (format-range, format-ranges, validate-range)
Script automation vba (run macro)